|
|
|
|
||||||||||||||||||||||||||||||||||||||||||||
|---|---|---|---|---|---|---|---|---|---|---|---|---|---|---|---|---|---|---|---|---|---|---|---|---|---|---|---|---|---|---|---|---|---|---|---|---|---|---|---|---|---|---|---|---|
|
1999 PRELIMINARY
REPORTS |
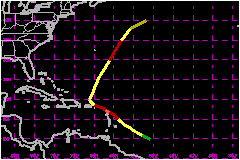
a. Synoptic HistoryThis hurricane originated from a tropical wave that moved off the west coast of Africa on 8 October. The wave moved slowly westward across the tropical Atlantic for several days. By 15 October, when the system was located about midway between Africa and the Lesser Antilles, its associated shower activity became better organized. The initial satellite classifications, a T1.0 on the Dvorak scale, were done at 1200 UTC 17 October. The disturbance developed into a tropical depression by 1800 UTC that same day, while located about 700 miles east of the southern Windward Islands. There was well-defined upper-tropospheric outflow over the depression. Moving west-northwestward, the depression strengthened into Tropical Storm Jose on the 18th while centered about 400 miles east of the Windward Islands. Initially, it appeared that a large mid-tropospheric high over the southwestern north Atlantic would steer the tropical cyclone on a westward to west-northwestward track for several days. However, a mid- to upper-tropospheric trough produced a weakness in the ridge in the vicinity of Puerto Rico. This imparted a more northward component to Jose's motion. After turning toward the northwest, Jose became a hurricane late on the 19th while centered about 150 miles east of the Leeward Islands. As it neared these islands, Jose reached its peak intensity of 98 mph at 1200 UTC 20 October. Turning back to a west-northwest heading, Hurricane Jose struck the northern Leeward Islands, passing over Antigua around midday on the 20th. The eye then moved near St. Barthelemy and St. Martin from 0000 to 0300 UTC on the 21st. As Jose moved over the northern Leeward Islands, southwesterly
vertical shear adversely impacted the tropical cyclone's intensity. Jose
weakened to a tropical storm by the time it reached Tortola in the British
Virgin Islands, around 1100 UTC on the 21st. A little later on the 21st,
the cyclone turned back toward the northwest, as the center passed about
50 miles northeast of the eastern tip of Puerto Rico. With a large mid-
to upper-tropospheric trough positioned over the western North Atlantic,
recurvature was now imminent. Jose turned northward, then north-northeastward
on the 22nd. The storm continued north-northeastward at a faster forward
speed on the 23rd, its structure still disrupted by southwesterly shear.
Early on the 24th, however, microwave data indicated that the low-level
center was becoming more involved with the deep convection. Satellite
intensity estimates indicate that Jose regained hurricane strength by
1200 UTC 24 October. The hurricane passed about 300 miles east of Bermuda
around midday on the 24th, and the forward speed increased markedly. The
rejuvenation of the tropical cyclone was short-lived. Jose weakened back
to a tropical storm around 0000 UTC 25 October. It continued to accelerate
into the North Atlantic, losing tropical characteristics by 1200 UTC on
the 25th. Later that day, the system merged with a larger mid-latitude
low and associated front. b. Meteorological StatisticsJose's peak intensity of 98 mph is based on: 1) 10 meter winds of that speed measured by a Global Positioning System dropsonde, and 2) 90% of 700 mb flight level winds of 106 mph. The highest measured wind speed from a surface reporting station was 81 mph with a gust to 102 mph at Antigua. Sustained winds of hurricane force (75 mph) were also measured at St. Maarten. The highest wind measurement from the Virgin Islands was 60 mph (sustained) with a gust to 69 mph at St. John. Higher wind speeds likely occurred over portions of the British Virgin Islands. In Puerto Rico, winds were mostly below tropical storm force, however there was an unofficial measurement (from a portable anemometer) of sustained winds of 35 to 45 mph with a gust to 55 mph from Costa Azul Beach in Luquillo. A ship with call sign 9HII6, located at 31.6N 59.5W,
reported winds of 130/98 mph on 24 October 1200 UTC. Further investigation
of this observation revealed that the wind speed was erroneously reported
to be about double its true value. 1. Rainfall Data Very heavy rains fell well after the passage of the center
over the northern Leeward Islands, in association with feeder bands well
east or southeast of the center. Rainfall totals were as high as 12 to
15 inches over portions of the islands. c. Casualty and Damage Statistics There were 2 deaths attributed to Jose; 1 in Antigua and
1 in St. Maarten.
Maximum Sustained Winds For Hurricane Jose
Minimum Pressure For Hurricane Jose
Landfall
for Hurricane Jose
| |||||||||||||||||||||||||||||||||||||||||||